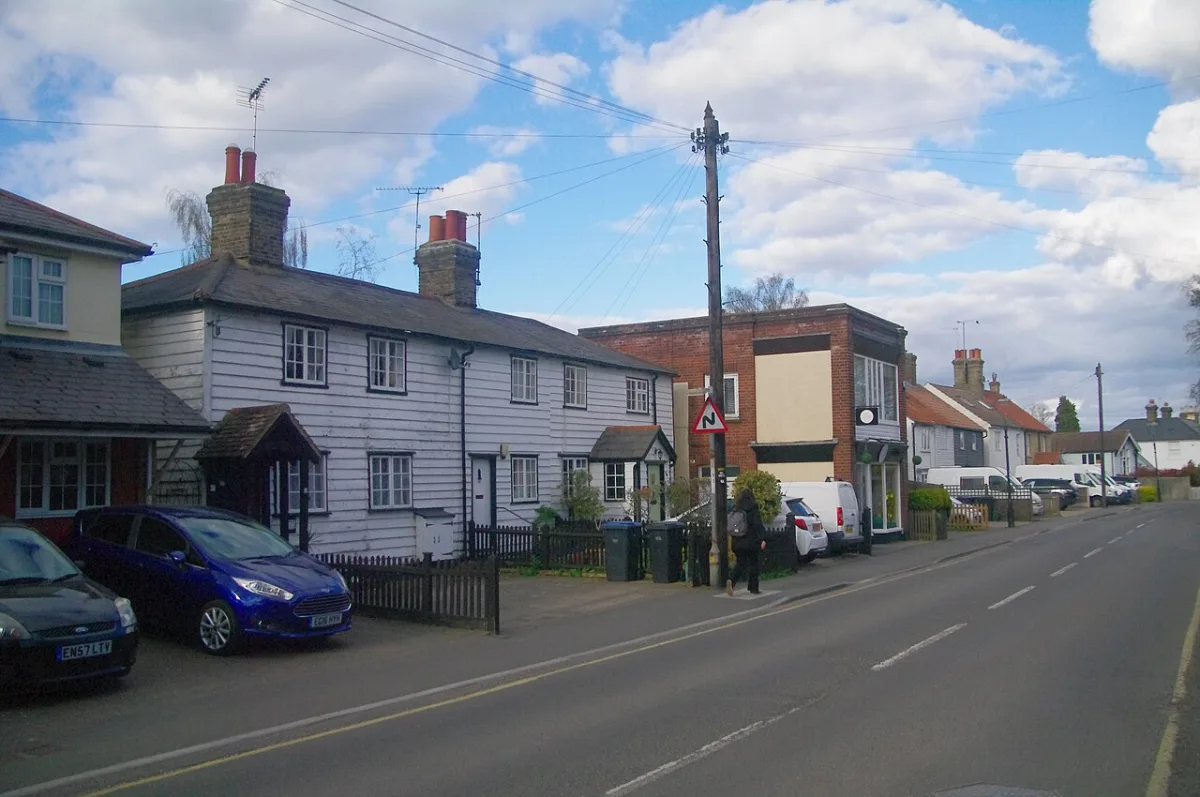

The average Harlow home sold for £319,860 in July 2026, up 4.4%, the biggest rise in Essex. Plus median sold prices for all 11 wards, £290,000 to £424,000.
The average home in Harlow sold for £319,860 in July 2026, the most recent month in the official UK House Price Index. That is up 4.4% over twelve months, against −0.3% across Essex, 0.5% in the East of England and 1.1% in England as a whole. It is the biggest annual rise of any of the fourteen local authority areas in Essex, and we have written it up as a separate report.
The number that matters more locally is how little the price changes as you move around the town. Land Registry sold prices for the twelve months to June 2026 put the median in Newhall and Church Langley North at £424,000 and the median in Little Parndon and the town centre at £290,000. That is the full range across a whole borough: a gap of £134,000, or 1.46 times. Harlow was built to a plan, in one go, mostly to the same standard, and thirty years of a market that sorts places into winners and losers has still not pulled it very far apart.
The borough average, and what moved
These are the mix-adjusted figures for the Harlow local authority in July 2026, from the UK House Price Index, which is built from completed Land Registry sales rather than asking prices.
| Property type | Average price | Change over 12 months |
|---|---|---|
| All property types | £319,860 | +4.4% |
| Detached | £630,324 | +4.1% |
| Semi-detached | £437,876 | +5.5% |
| Terraced | £322,044 | +5.5% |
| Flat or maisonette | £183,628 | +1.6% |
Houses went up and flats went down, which is the same split showing across most of the East of England. The detail worth knowing in Harlow is that the terraced figure, £315,241, is within £2,000 of the all-property average. In most towns the headline average is a blend of very different things. Here it is essentially the price of a terraced house, because that is what the town is made of.
Of the 945 residential sales the Land Registry recorded in the Harlow district in the twelve months to June 2026, 471 were terraced houses. Just under half of everything sold. Flats were 217, semi-detached 140 and detached 117.
Median sold price by area
The UK House Price Index only publishes down to the whole local authority. To get below that, we took every sale HM Land Registry recorded in the Harlow district between 1 July 2025 and 30 June 2026, matched each postcode to its ward, and took the median. Medians, not averages, so one large sale cannot move the figure.
| Ward | Median sold price | Sales |
|---|---|---|
| Church Langley North & Newhall | £424,000 | 111 |
| Old Harlow | £385,000 | 125 |
| Church Langley South & Potter Street | £360,000 | 115 |
| Great Parndon | £344,150 | 80 |
| Bush Fair | £320,000 | 91 |
| Latton Bush & Stewards | £320,000 | 95 |
| Sumners & Kingsmoor | £320,000 | 70 |
| Mark Hall | £317,000 | 59 |
| Netteswell | £315,000 | 79 |
| Passmores | £310,000 | 63 |
| Little Parndon & Town Centre | £290,000 | 57 |
Three things come out of that list.
The two Church Langley wards and Old Harlow are the top three, and they are the three that are not new town. Church Langley and Newhall were built from the late 1980s onward on land east of the original designated area, to a different brief and mostly for private sale. Old Harlow is the village that was there before 1947. Everything in between, the planned neighbourhoods the Development Corporation laid out, sits in a band from £310,000 to £344,150.
Seven of the eleven wards are within £30,000 of each other. Bush Fair, Latton Bush and Stewards, and Sumners and Kingsmoor all land on exactly £320,000. That is not a coincidence of rounding, it is what happens when a town’s housing stock was built to one specification.
The town centre ward is the cheapest, not the dearest. In most English towns the centre carries a premium for the walk to the station and the shops. In Harlow the centre ward has the highest share of flats in the sample, and flats are the one category that fell over the year.
Prices by property type, from the sold-price records
The Land Registry sample gives raw medians by type across the whole district, which are worth putting next to the mix-adjusted averages above.
| Property type | Median sold price | Sales | Share of sales |
|---|---|---|---|
| Detached | £520,000 | 117 | 12% |
| Semi-detached | £425,000 | 140 | 15% |
| Terraced | £333,000 | 471 | 50% |
| Flat or maisonette | £200,000 | 217 | 23% |
A detached house in Harlow is 2.6 times the price of a flat. That is a wide gap, but there are only 117 detached sales in a year across a town of 98,000 people, and most of them are in Church Langley, Newhall or Old Harlow. For the majority of buyers the real choice is between a £200,000 flat and a £333,000 terrace.
At street level, the highest median of any Harlow street with at least eight recorded sales in the year was Albert Gardens in Church Langley, at £442,500, followed by Malkin Drive at £407,500 and Ridgeways at £390,500. All three are in the newer east of the town.
First-time buyers and home movers
The UK House Price Index splits buyers as well as properties. A first-time buyer in Harlow paid an average of £288,823 in July 2026. A home mover, someone selling one property to buy another, paid £381,073.
The £92,250 between those two figures is the size of the step from a first flat or terrace to a family house in this town. It is a smaller step than in most of the South East, which is the practical argument for buying in Harlow rather than further down the line into Hertfordshire or Epping Forest.
How Harlow compares
| Area | Average price | Change over 12 months |
|---|---|---|
| Harlow | £319,860 | +4.4% |
| Essex | £359,978 | −0.3% |
| East of England | £337,518 | +0.5% |
| England | £293,479 | +1.1% |
Harlow is £40,118 below the Essex average and about £26,000 above the England average. Among the local authorities in the Essex area it is the third cheapest place to buy, after Tendring at £259,568 and Colchester at £297,824, and it is far cheaper than the two districts on its own doorstep: Epping Forest, which wraps around Harlow to the south, west and east, averages £525,719, and Uttlesford to the north-east averages £476,329.
That is the whole commercial case for the town in one line. Harlow is 38km from London with a thirty-one minute train into Liverpool Street, and it is £205,859 cheaper than the district immediately next to it.
What it means for you
If you are buying, the flat spread across the town means location is doing less of the work here than almost anywhere else in the South East. The difference between the dearest ward and the cheapest is smaller than the difference between a terrace and a semi anywhere in town. Choose on the house and the walk to the station, not on the postcode.
If you are selling, the sold-price record is public and buyers in Harlow use it. With 471 terraced sales in a year, there will be genuinely comparable transactions on or near your street, and an asking price a long way above them tends to sit.
If you are staying put, your home gained 4.4% in cash terms over the year, while Essex as a whole lost 0.3%. Every property type rose this time, flats included, though flats gained least at 1.6%.
Frequently asked questions
What is the average house price in Harlow?
The average home in the Harlow district sold for £319,860 in July 2026 on the provisional UK House Price Index, built from completed HM Land Registry sales. That covers every property type across the whole local authority.
Are Harlow house prices going up or down?
Up, and faster than anywhere else in the county. Prices rose 4.4% in the year to July 2026, against −0.3% across Essex and 1.1% in England. All four property types gained. The average is still £7,054 below the town’s January 2023 peak of £326,914.
Which is the most expensive part of Harlow?
Church Langley North and Newhall, at a median of £424,000 for sales registered between July 2025 and June 2026, followed by Old Harlow at £385,000. Both are outside the original new town neighbourhoods.
Which is the cheapest part of Harlow?
Little Parndon and the town centre, at a median of £290,000. The ward has the highest share of flats in the town, and flats are the cheapest category.
How much is a terraced house in Harlow?
The median terraced sale was £333,000 over the twelve months to June 2026, and the mix-adjusted average was £322,044 in July 2026. Terraced houses were half of all sales in the district.
Is Harlow cheaper than the rest of Essex?
Yes, by £40,118. Only Tendring and Colchester are cheaper among the Essex-area authorities. Harlow is £205,859 below neighbouring Epping Forest.
Where can I check what one specific house sold for?
Every completed sale in England and Wales is public. Search a street or an address free on the HM Land Registry Price Paid service.
Sources
- UK House Price Index, Harlow (HM Land Registry) for the district averages and the property-type and buyer-type figures.
- UK House Price Index, Essex, East of England and England for the comparison table, plus the same series for Tendring, Colchester, Epping Forest and Uttlesford.
- HM Land Registry Price Paid data for the 945 residential sales behind the ward, street and property-type medians. Sales are filtered to those the Land Registry records in the Harlow district, which matters here because none of Harlow’s four postcode areas lies wholly inside the borough. Postcodes were matched to wards using postcodes.io.
- HM Land Registry Price Paid search to look up an individual address.
Land Registry figures are provisional and are revised as sales complete and are registered, so the most recent months in the sold-price sample are still filling up. Commercial and other non-residential sales are excluded. Checked on 10 August 2026.
More Harlow local information: trains to London, roadworks and travel, planning news and things to do in Harlow.
Have your say