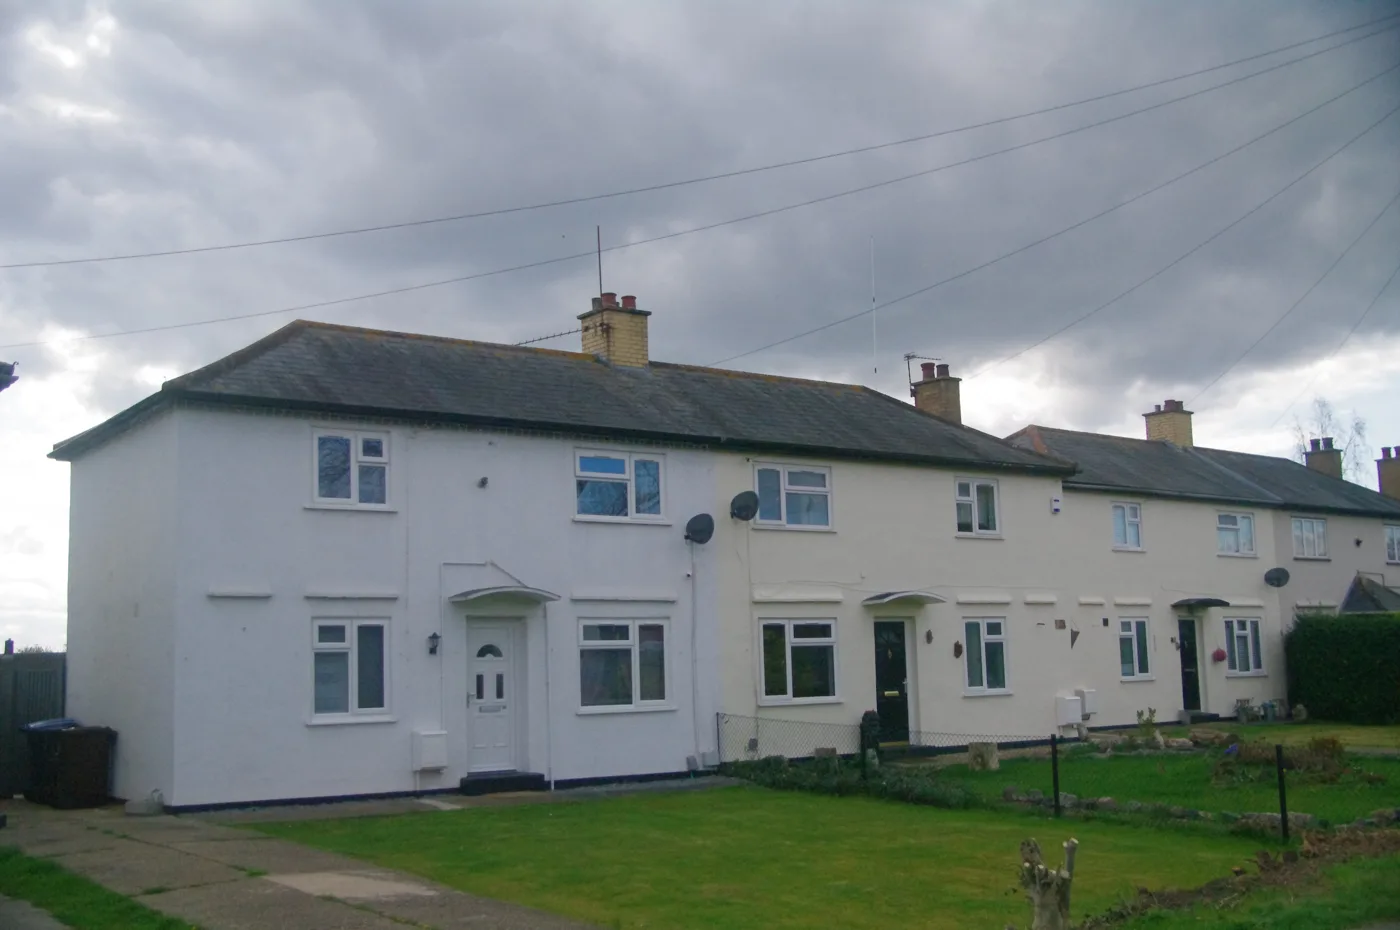

UK House Price Index July 2026: England up 1.1%, Harlow up 4.4% to £319,860, the biggest rise of all 14 Essex areas while Essex overall fell 0.3%.
The average Harlow home was worth £319,860 in July 2026, up £13,476 over twelve months. That is a rise of 4.4%, and it is the biggest annual increase of any of the fourteen local authority areas in Essex.
The figures come from the UK House Price Index, published by HM Land Registry on 17 September.
Harlow also led Essex on the month, rising 1.8% between June and July. No other Essex area managed more than 1.3%.
The county around it did the opposite. Essex as a whole fell 0.3% over the year, and six of its fourteen areas lost value. England rose 1.1% and the East of England 0.5%, so Harlow beat its county, its region and the country.
Where Harlow sits in Essex
Two things to keep in mind before reading too much into that.
The UK House Price Index is a mean average, not a median. A handful of expensive sales in a small district moves it. Harlow is a small district: the index recorded 64 sales here in May 2026, the most recent month with a published sales count.
And Harlow is rising from a low base. At £319,860 it remains the third cheapest area in Essex, ahead of only Tendring at £259,568 and Colchester at £297,824. Next door in Epping Forest the average is £525,719, which is £205,859 more than in Harlow. Over the border in East Hertfordshire it is £457,417.
Still below the 2023 peak
The town has not got back what it lost.
The Harlow average peaked at £326,914 in January 2023. July 2026 is £7,054 below that, three and a half years later. The index reads 97.8, where January 2023 is set at 100.
The gap has narrowed sharply, though. When we reported the June figures the shortfall was more than £13,000. One strong month has cut it roughly in half.
Every property type rose
All four types gained value over the year, which is unusual in Essex this summer. In Southend and across the county, flats were falling.
| Type | Average price | Change over 12 months |
|---|---|---|
| Detached | £630,324 | +4.1% |
| Semi-detached | £437,876 | +5.5% |
| Terraced | £322,044 | +5.5% |
| Flat or maisonette | £183,628 | +1.6% |
Semi-detached and terraced homes led, at 5.5% each. Those are the two types most of Harlow lives in, so the headline figure is not being carried by a few large houses at the top.
Flats moved least. At £183,628 a Harlow flat is now £138,416 cheaper than a terraced house in the same town.
What it means for you
If you are buying your first home here. The index puts the average first-time buyer purchase in Harlow at £288,823 in July, up 4.4% on the year. That is £4,656 below the England average for all buyers. Harlow remains one of the cheaper ways into the Essex and Hertfordshire commuter belt, but the gap is closing as prices climb.
If you are selling. The mix-adjusted average is not a valuation of your house. It is a statistical measure across the whole district, built from completed Land Registry sales. Semi-detached and terraced sellers have had the better year on these figures.
If you are watching the market. Sales volumes are the number to keep an eye on, and they are lagging. Land Registry counts stop at May 2026 because recent sales are still being registered. On the figures so far:
- 351 sales in Harlow from January to May 2026
- 490 over the same months in 2025
- 348 over the same months in 2024
The 2025 figure is distorted. March 2025 alone recorded 201 sales as buyers rushed to complete before the stamp duty thresholds changed on 1 April that year. Strip that spike out and 2026 is running at roughly the 2024 level, not collapsing.
Council tax is charged on 1991 values rather than current ones, so a rising average does not move your band. Our guide to Harlow council tax bands sets out what each band costs in 2026/27, and our Harlow house prices page carries median sold prices for all eleven wards.
Correction
When we published the June 2026 figures on 22 August we gave the Harlow average as £313,338, up £5,143 on the year. HM Land Registry has since restated June as £314,050, up 1.9%. That is £712 higher than the figure we published.
Revisions are normal: each monthly release restates earlier months as more sales are registered. We flag them rather than quietly changing the old page.
Sources
- UK House Price Index, Harlow, July 2026, HM Land Registry
- UK House Price Index, Essex, July 2026, HM Land Registry
- UK House Price Index, England, July 2026, HM Land Registry
Have your say