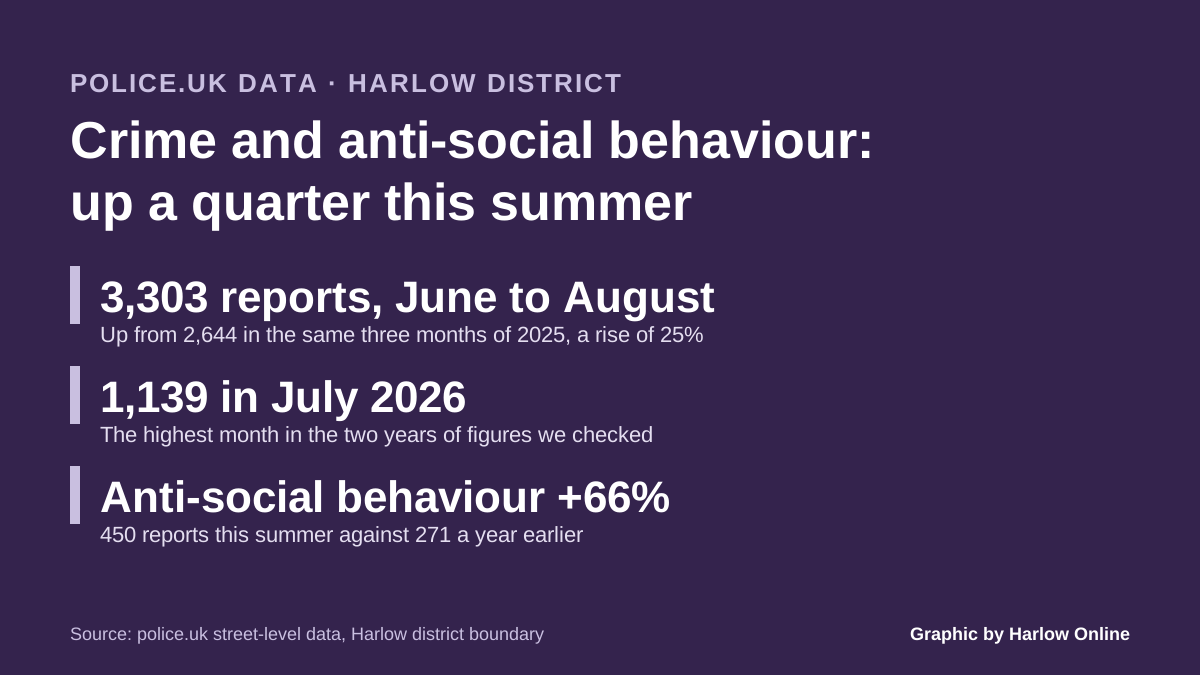

Police logged 3,303 crime and anti-social behaviour reports in Harlow from June to August, up 25% on 2025. Violence and ASB drove the rise; July was the peak.
Police recorded 3,303 crimes and incidents of anti-social behaviour in the Harlow district between June and August this year. That is 25 per cent more than in the same three months of 2025, when the figure was 2,644.
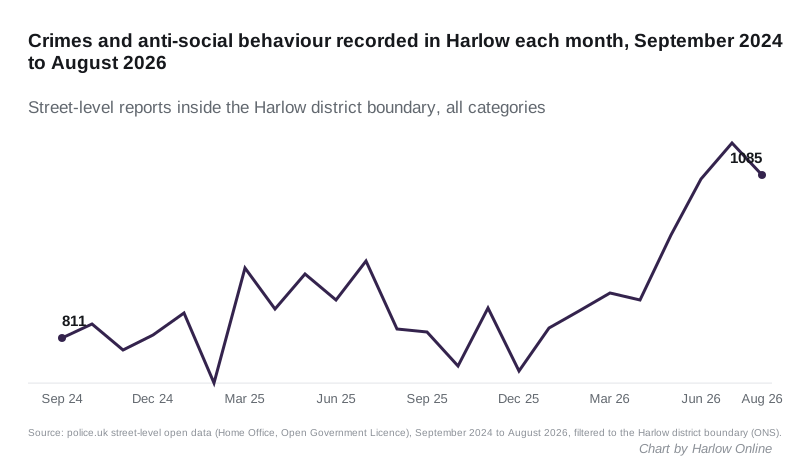
July was the busiest month in the two years of figures we checked, with 1,139 reports. August had 1,085.
Updated 12 November: September’s figures are now out. Police recorded 997 reports in the Harlow district in September 2026, down from August but 21 per cent more than the 821 in September 2025. Councillors agreed the community safety review on 3 November (see below).
The figures are the Home Office’s street-level police.uk open data, which Essex Police supplies every month. We counted every report the data places inside the Harlow district boundary for each month from September 2024 to August 2026.
What went up
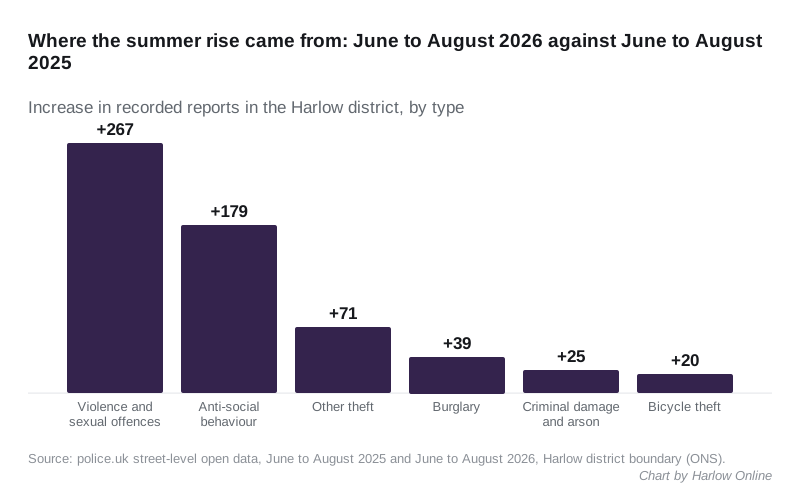
Two categories account for most of the summer rise. Comparing June to August 2026 with the same months of 2025:
- Violence and sexual offences: 1,325 reports, up from 1,058 (an extra 267)
- Anti-social behaviour: 450, up from 271 (an extra 179, or 66 per cent)
- Other theft: 208, up from 137
- Burglary: 94, up from 55
- Criminal damage and arson: 245, up from 220
- Bicycle theft: 51, up from 31
Some things fell. Public order offences were down slightly over the summer, from 245 to 236, and possession of weapons was down from 38 to 37.
Over a full year the rise is smaller
The summer jump is sharper than the longer trend. Across the 12 months to August 2026, the data holds 10,939 reports for the district, against 10,199 in the previous 12 months. That is a rise of 7.3 per cent.
Over those 12 months:
| Type | Sept 2024 to Aug 2025 | Sept 2025 to Aug 2026 | Change |
|---|---|---|---|
| Violence and sexual offences | 3,985 | 4,357 | +9% |
| Anti-social behaviour | 860 | 1,184 | +38% |
| Criminal damage and arson | 812 | 852 | +5% |
| Public order | 881 | 821 | -7% |
| Shoplifting | 849 | 759 | -11% |
| Vehicle crime | 719 | 620 | -14% |
| Other theft | 590 | 708 | +20% |
| Drugs | 578 | 569 | -2% |
| Burglary | 243 | 351 | +44% |
| Robbery | 100 | 127 | +27% |
Shoplifting and vehicle crime both fell over the year. Burglary rose by more than 100 reports.
Harlow had 98,543 residents in mid-2025, according to the ONS population estimate on Nomis. The 12-month total works out at about 111 reports for every 1,000 people.
How Harlow compares with its neighbours
We ran the same count for five neighbouring districts, using slightly simplified boundaries, so treat these as close approximations. Comparing June to August 2026 with June to August 2025:
| District | Change in reports |
|---|---|
| Harlow | +25% |
| Chelmsford | +20% |
| Uttlesford | +18% |
| Epping Forest | +7% |
| East Hertfordshire | +4% |
| Brentwood | +1% |
Harlow’s rise was the steepest of the six. Chelmsford and Uttlesford also rose sharply, which suggests the summer increase is not Harlow’s alone.
What the figures can and cannot tell you
The police.uk data is a count of reports, not of offenders or convictions. It does not say why the numbers moved. More reporting, changes in how incidents are recorded and more offending can all push the count up, and the data cannot separate them.
Each report is placed at an anonymised map point near where it happened, not at an exact address. Anti-social behaviour counts incidents, which are not all crimes.
We have not found a statement from Essex Police explaining the summer figures. We will add one if the force publishes it.
Councillors are reviewing community safety
Harlow Council’s Scrutiny Committee agreed on 3 November to set up a task and finish review of policing and community safety. The minutes record that the terms of reference were agreed. Youth councillors will be involved in the review.
The submission form was put forward by Councillor Kay Morrison and supported by Councillor Matt Saggers. The review is called Protecting People from Harm and Safe Communities.
It will look at what the Safer Harlow Partnership is doing on:
- domestic abuse and violence against women and girls
- child exploitation
- road safety
- town centre safety
- vehicle crime
It will take evidence from Essex Police, the council’s community safety team and the Safer Harlow Partnership. The aim is a communications action plan and “quick wins” for the partnership to adopt.
September’s figures
In September 2026, police recorded 997 reports in the Harlow district, against 821 in September 2025. The biggest increases on a year earlier were:
- Violence and sexual offences: 398, up from 329
- Shoplifting: 101, up from 42
- Anti-social behaviour: 111, up from 69
Vehicle crime fell, from 63 to 44.
What it means for you
- Check your own area. Enter your postcode on police.uk to see the reports mapped near your street, and the name of your neighbourhood policing team.
- Report what you see. Call 999 in an emergency. For anything else, Essex Police takes reports, including anti-social behaviour, online or on 101.
Method: we downloaded every street-level report from the police.uk API for each month from September 2024 to September 2026, using the ONS boundary for the Harlow local authority district. Neighbour comparisons use the same method with simplified boundaries.
Have your say