
2,855 Harlow residents claimed unemployment benefits in September, 4.6% of 16 to 64s and up 170 in a year. Passmores tops the wards at 6.4%.
2,855 people in the Harlow district were claiming unemployment-related benefits in September. That is 4.6 per cent of residents aged 16 to 64, and the highest monthly count since October 2024.
The figures are from the Office for National Statistics claimant count, published on Nomis on 21 October. The count rose by 40 on August and by 170 on September last year, when it stood at 2,685.
Harlow is rising faster than the region
Over the year, Harlow’s count went up by 6.3 per cent. The East of England rose by 4.1 per cent and Great Britain by 3.0 per cent, on the same ONS figures.
Harlow’s rate is still the highest in the area:
| Area | Claimants, September 2026 | Share of 16 to 64s |
|---|---|---|
| Harlow | 2,855 | 4.6% |
| Broxbourne | 2,130 | 3.3% |
| Epping Forest | 2,700 | 3.2% |
| Uttlesford | 1,175 | 2.1% |
| East Hertfordshire | 1,950 | 2.0% |
| East of England | 132,405 | 3.3% |
| Great Britain | 1,668,680 | 3.9% |
Epping Forest has almost as many claimants as Harlow, but a larger working-age population. So its rate is much lower.
Ward by ward
The gap inside the town is wide. In Passmores, 325 people were claiming, 6.4 per cent of working-age residents. That is about one adult in sixteen.
In Church Langley North and Newhall, 110 people were claiming, 2.0 per cent. The Passmores rate is more than three times that.
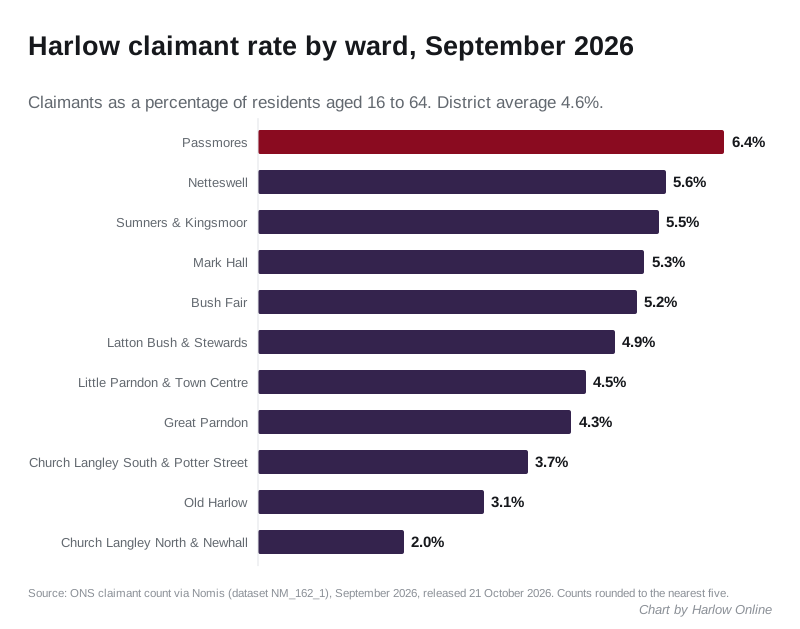
The full ward figures for September:
| Ward | Claimants | Rate |
|---|---|---|
| Passmores | 325 | 6.4% |
| Netteswell | 315 | 5.6% |
| Sumners & Kingsmoor | 315 | 5.5% |
| Mark Hall | 285 | 5.3% |
| Bush Fair | 305 | 5.2% |
| Latton Bush & Stewards | 310 | 4.9% |
| Little Parndon & Town Centre | 275 | 4.5% |
| Great Parndon | 210 | 4.3% |
| Church Langley South & Potter Street | 220 | 3.7% |
| Old Harlow | 180 | 3.1% |
| Church Langley North & Newhall | 110 | 2.0% |
Source: Nomis, claimant count by ward, September 2026.
Every age group is up
The rise over the year is spread across ages, not just young people this time:
- 16 to 24: 575, up from 515 (60 more)
- 25 to 49: 1,620, up from 1,540 (80 more)
- 50 and over: 655, up from 630 (25 more)
One claimant in five is under 25. The age groups add up to 2,850 rather than 2,855 because the ONS rounds every figure to the nearest five.
What the figure counts
The claimant count is people claiming Jobseeker’s Allowance, plus people on Universal Credit who are required to look for work. It is not the full measure of unemployment. It is the only jobs figure published every month for areas as small as a ward.
Earlier months can be revised. In August we reported a June figure of 2,850, from the first release. The ONS series now shows June at 2,815. September’s 2,855 is the highest month in the revised series since October 2024, when the count was 2,865.
What it means for you
- If you have lost work or had your hours cut, the main route to support is Universal Credit, claimed online.
- If your income is low, Harlow Council’s Council Tax Support cuts your bill. Our Harlow council tax bands page sets out what each band pays.
- If you are a school or college leaver, 575 under-25s are now claiming in the district, 60 more than a year ago, so expect competition for entry-level jobs.
The October figures are due from the ONS in November. We will report them when they appear.
Sources
- Office for National Statistics, claimant count, Nomis dataset NM_162_1, Harlow, neighbouring districts, East of England and Great Britain, September 2025 to September 2026, retrieved 21 October 2026
Have your say